Data
Through our partnerships with labor market analysts, economic development agencies, industry and “real-time” labor information tools such as Jobs EQ, we determine the employment, wage, demographic data, and occupational projections to forecast workforce changes in our area.
We compare business skills demand against training supply and inform training and education providers, colleges and partners so that industry needs for skilled talent can be addressed, while helping individuals gain the needed skills for employment in our region’s high-growth industries.
Advancing economic mobility in Southwest Washington through job quality and training opportunities
Through investments in local companies, community organizations, economic development, and higher education, WSW builds strong partnerships to develop the economy and support business growth, provide opportunities for economic mobility and challenge systems that bar individuals from economic prosperity. Our investments match the needs of local businesses with a highly skilled and trained workforce, creating greater economic success across Southwest Washington.
In the 2023-2024 program year

0
services provided
0
businesses received employee training, recruiting and placement assistance, layoff aversion and other services

0
individuals were placed into jobs with a median annual salary of $45,760

0%
of individuals placed into jobs made more than $17/hr
$0+ mil
invested in training and career services for youth and adults
$0
invested in training for existing and new employees to support business growth and sustainability
People trained for in-demand jobs
Between July 2023 and June 2024, we invested in training for job seekers and workers, including on-the-job training, work experiences, incumbent worker training and internships.

0
Construction

0
Healthcare

0
Manufacturing
Envisioning a region where economic prosperity and growth exists for every person
Across the region, individuals from underprioritized communities and families with low- and middle-income lack the economic opportunities pivotal to success. Access to training and quality jobs creates a talented workforce and further opportunities to grow businesses and create a strong economy.
Our investments serve businesses and individuals to align a skilled workforce with quality jobs, creating opportunity and economic prosperity.

0%
of participants served self-identified as Black, Indigenous or Person of Color
Participants by Race/Ethnicity

| White | 67% |
| Decline to identify | 8.5% |
| Asian | 6.6% |
| Black or African American | 6.1% |
| Two or more races | 4.3% |
| Native American or Alaska Native | 2.2% |
| Native Hawaiian or Pacific Islander | 2.1% |
Participants by Education Level

| General Education Development, high school equivalent or high school diploma | 34.8% |
| Some college | 20.8% |
| Bachelor’s degree | 14.0% |
| Less than high school | 11.6% |
| Associate degree | 9.4% |
| Master’s degree | 4.4% |
| Other post-secondary degree or certificate | 4% |
| Attained Certificate of Attendance/Completion after successfully completing an Individual Education Plan in high school | 0.5% |
| Doctorate | 0.3% |
| Did not identify | 0.2% |
Participants by Gender

| Female | 54.1% |
| Male | 43.5% |
| Other or decline to identify | 1.9% |
Participants who identified with having a Disability

| Does not have a disability | 81.0% |
| Does have a disability | 13% |
| Declined to identify | 6% |
Participants by County

| Clark County | 1,540 |
| Cowlitz County | 548 |
| Wahkiakum County | 19 |
System Locations
WSW invests in career centers, education partners and community-based organizations to reach and serve job seekers from all walks of life. Having services available in a variety of locations improves accessibility to no-cost workforce services for youth, adults, students and rural communities. Services available include career coaching and guidance, training and educational opportunities and support services.
During 2023 – 2024 career and employment services funded by WSW were offered through:
- Bridgeview Resource Center
- Clark College
- Fourth Plain Forward
- Love Overwhelming
- Lower Columbia College
- Next
- Wahkiakum County Health and Human Services
- Washington State University Vancouver
- WorkSource Cowlitz/Wahkaikum
- WorkSource Vancouver

Funding
WSW’s budget for PY23 was $8.5 million, of which 92% went into the community through contracted services and support.
Funding Spent by Type

| Federal | 79% |
| State | 17.8% |
| Private | 2% |
| Local Government | 0.01% |
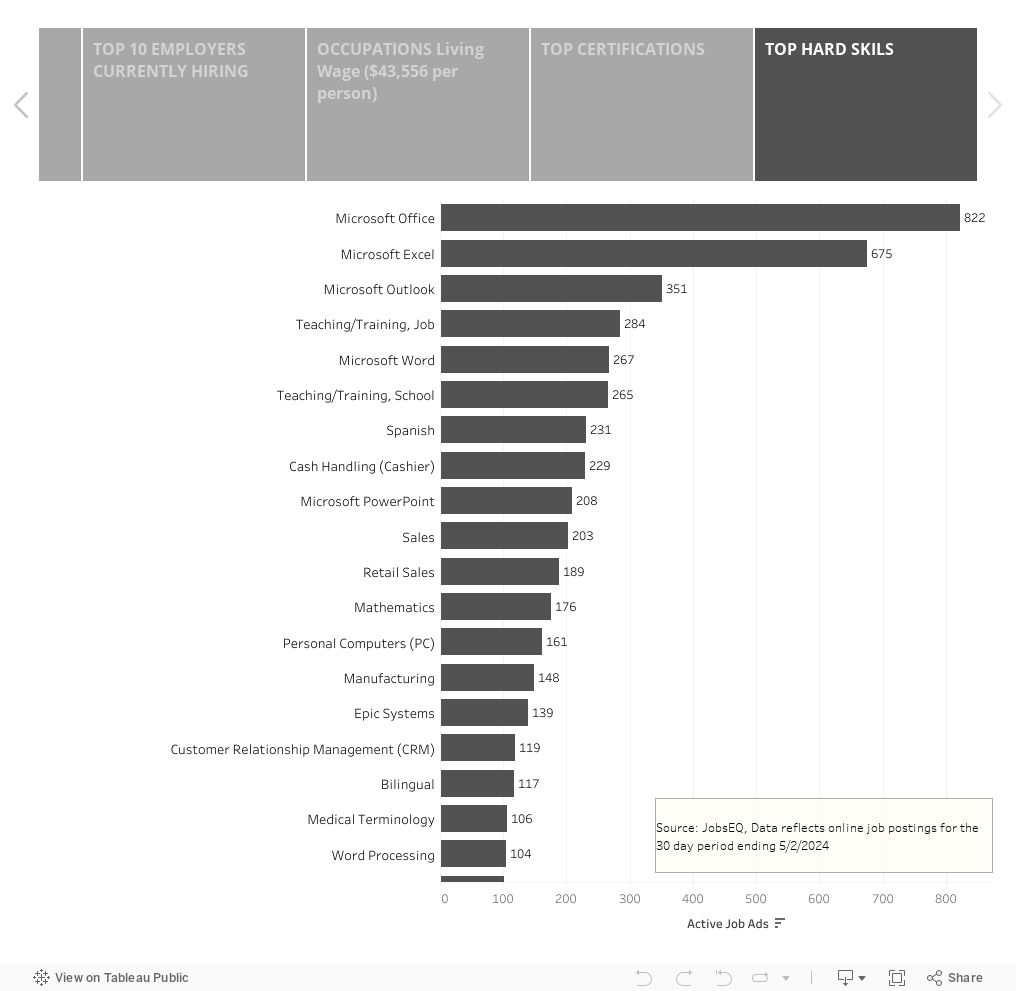
In-demand occupations, certifications and skills
Clark County
195,521 Total Employment
(Q2 2024)
$68,974 Average Annual Wage
(Q2 2024)
4.50% Unemployment Rate
(October 2024)
Top Industries by Employment Q2 2024
| Industry | Number Employed | Avg. Annual Wages |
|---|---|---|
| Healthcare and Social Assistance | 32,243 | $68,658 |
| Retail Trade | 19,775 | $42,099 |
| Construction | 19,176 | $75,240 |
| Educational Services | 17,683 | $49,999 |
| Accommodation and Food Services | 15,393 | $30,017 |
| Manufacturing | 14,612 | $74,529 |
Cowlitz County
43,509 Total Employment
(Q2 2024)
$64,095 Average Annual Wage
(Q2 2024)
4.90% Unemployment Rate
(October 2024)
Top Industries by Employment Q2 2024
| Industry | Number Employed | Avg. Annual Wages |
|---|---|---|
| Manufacturing | 7,398 | $81,005 |
| Healthcare and Social Assistance | 6,580 | $60,722 |
| Retail Trade | 5,128 | $39,732 |
| Educational Services | 3,425 | $59,408 |
| Construction | 3,411 | $78,823 |
| Accommodation and Food Services | 3,335 | $26,159 |
Wahkiakum County
912 Total Employment
(Q2 2024)
$42,466 Average Annual Wage
(Q2 2024)
6.50% Unemployment Rate
(October 2024)
Top Industries by Employment Q2 2024
| Industry | Number Employed | Avg. Annual Wages |
|---|---|---|
| Agriculture, Forestry, Fishing and Hunting |
144 | $45,400 |
| Retail Trade | 107 | $28,999 |
| Public Administration | 105 | $47,626 |
| Utilities | 78 | $77,345 |
| Manufacturing | 65 | $35,059 |
| Accommodation and Food Services | 64 | $20,228 |
Workforce-Related Information
Demographics and Household Profiles
Public School Statistics